

Ever find that, despite meticulous budgeting and tracking account balances each month, you’re still left wondering: how am I doing?
It took me several years of tracking my finances to come to the realization that I was missing something: financial ratios.
I suspect that my early journey learning about stocks, investing, and corporate financial statements ultimately led me to important of financial ratios. What you find analyzing a stock or a corporate financial statement is that, aside from simply reporting metrics like revenue, cash flow, and profit, analysts and experts leverage things like earnings-per-share, return on equity or revenue-per-employee to make sense of static figures and as a means of comparison.
To use an example, you might learn that a public company’s financials for the quarter included revenue of $1 billion, with $250 million in expenses.
Is that good? How does it compare to similar companies in their industry?
One thing you could do is to take the 25% expense ratio (expenses divided by revenue) and compare it to others in the industry. Or you could simply consider the fact that the company is keeping 75% of all money it takes in – an objectively high amount in almost any line of work.
Of course, this is one simple metric, but the premise holds true for personal finance.
Of all the tinkering I have done in my own balance sheet and spending tracker, the addition of ratios has contributed the most to my understanding of the numbers.
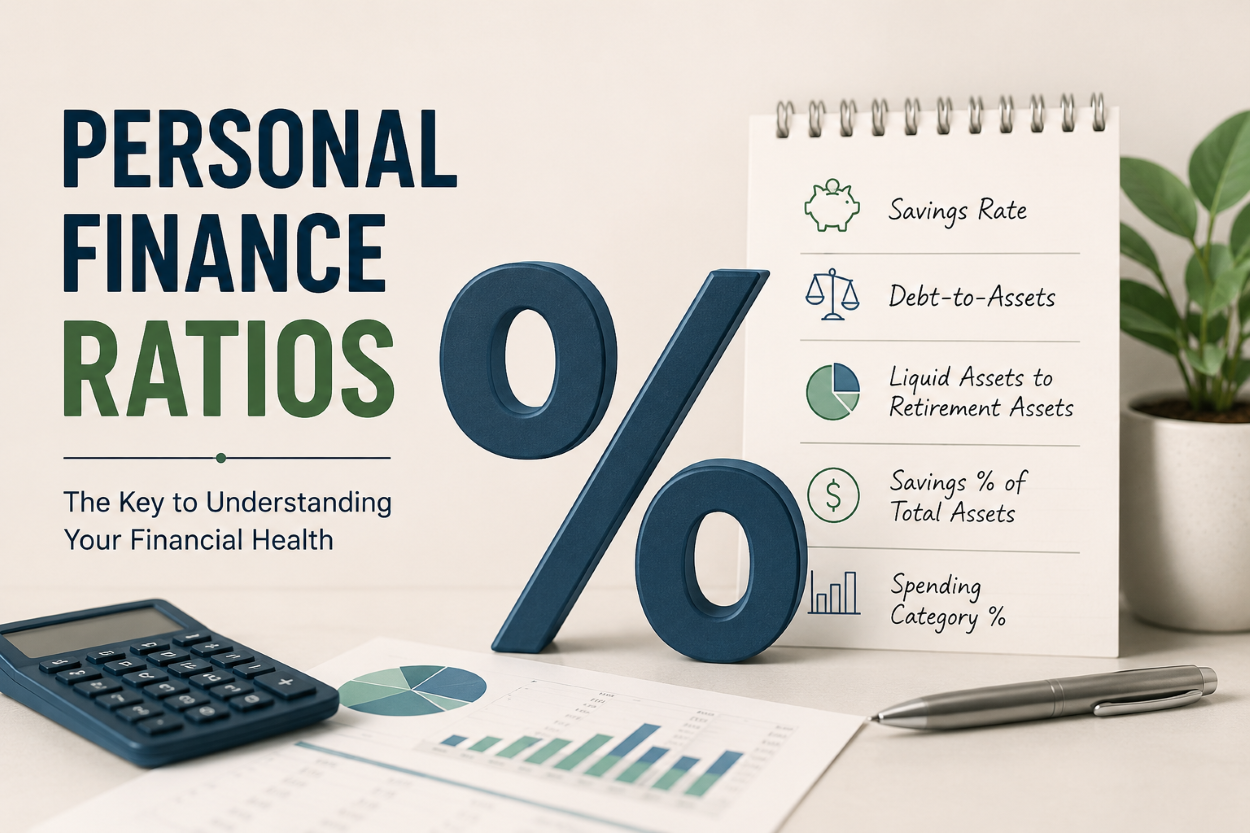
Here are a few I have found useful:
| Ratio | What It Measures | Goal |
|---|---|---|
| Liquid Assets-to-Retirement Assets | Accessibility of your wealth | Depends on life stage |
| Savings % of Total Financial Assets | Cash allocation | Adjusting cash holdings |
| Debt-to-Assets | Leverage | Lower is generally better |
| Savings Rate | Wealth-building capacity | Increase over time |
| Spending Category % | Spending habits | Align with your priorities |
Liquid assets-to-retirement assets. This shows me how much savings + taxable investments we have, relative to how much is sitting in retirement accounts we can’t touch. For example, a ratio of ¾ or 75% would mean that our accessible funds are 75% as valuable as our retirement accounts.
Ex. Liquid assets = $75,000 and retirement accounts = $100,000 (75,000/100,000 = 3/4 or 75%)
Savings as % of Total Financial Assets. Of all the money to your name, including retirement accounts, employer stock, taxable brokerage accounts, savings etc. – how much of it is in “savings” (i.e. checking/savings/CD/Money Market Funds).
This is a great metric for seeing how much cash you are holding, allowing you to adjust your cash pile as needed (increase it when saving for something big like a down payment on a home, or reduce it, when you don’t expect major purchases and want to maximize growth via investing).
Debt-to-Assets. Essentially, this is how much debt we are carrying relative to the value of assets on the balance sheet. This is undoubtedly one of the best metrics to track and can really help you make sense of your debt load. The closer to 0 the better.
Ex. Mortgage/Total Financial Assets + Home Value
$250k Mortgage/($200k TFA + $400k Home) = .4167 or 41.7%
Savings Rate. You are likely most familiar with this one, but what’s really cool about the savings rate is that you can modify it in a number of ways.
You might be curious about both your pre-tax and post-tax savings rates. If you really want to be an aggressive saver and investor, you might even exclude retirement contributions in those figures. It’s really up to you how deep you want to go here, but this is my favorite one to track. If you can maintain a high savings rate, in addition to the amount you save for retirement, financial success is just around the corner.
Knowing your savings rate is also an easy way to benchmark your progress relative to those your age.
Spending Category %. When doing your budget/spending for the month, it helps to track how much you spent in a given category so that you can calculate them as percentages of the total spend. You can be under budget overall but still overspend on food or recreation or shopping.
This will help you adjust how you spend your money month-to-month.
Final Thoughts
Budgets tell you where your money went. Net worth tells you what you’ve accumulated. But ratios tell you how efficiently your finances are working together.
The months add up to years, and the tracking you do will paint a clear picture over time about how well you’re managing your money.
If you do track ratios, which ones do you track? We would love to hear from you.
Discover more from The Budget Brainiac
Subscribe to get the latest posts sent to your email.


